• Flowstate
Flowstate
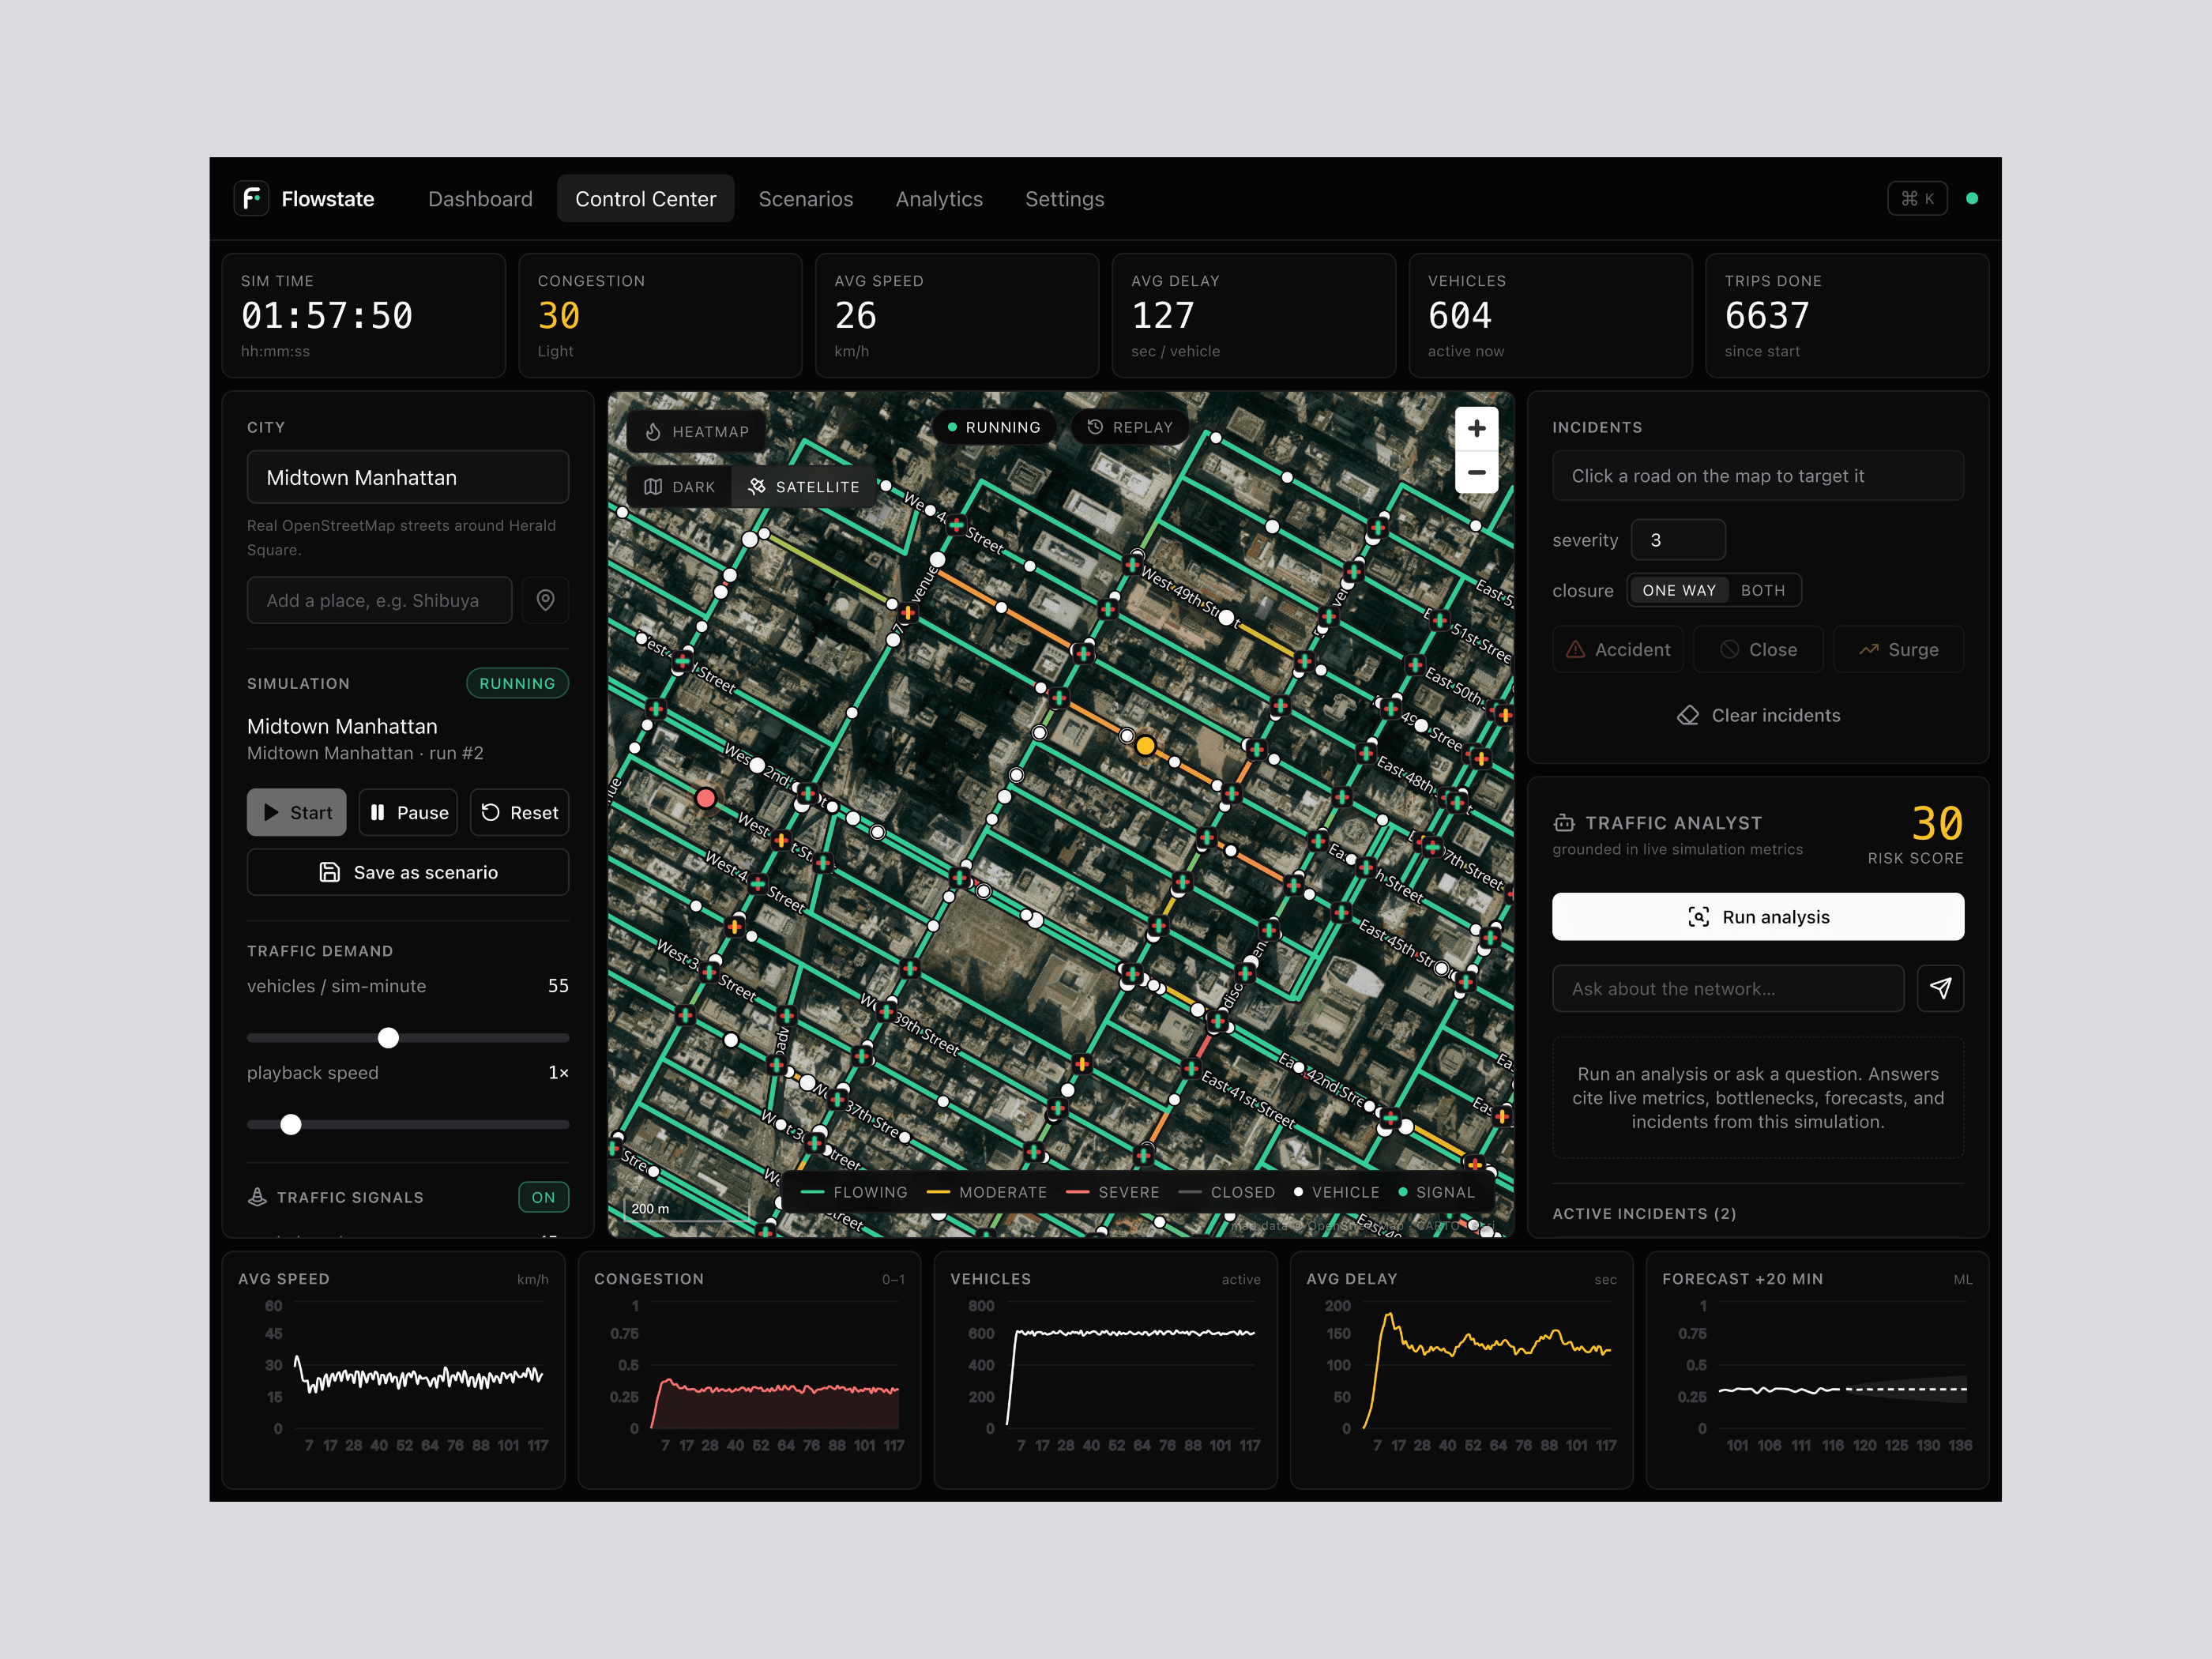
Flowstate simulates traffic on real street networks from OpenStreetMap. It compares the effects of road closures, accidents, and changes in demand against a baseline simulation. The app also forecasts congestion 20 minutes ahead, detects unusual traffic patterns, and includes a traffic analyst that answers questions using simulation data.
Project Type
Design, Development, Machine Learning, AI IntegrationTools Used
Next.js, Tailwind CSS, MapLibre GL, Recharts, FastAPI, Python, scikit-learn, PostgreSQL, WebSockets, OpenStreetMapProject Overview
The simulator includes road networks for Midtown Manhattan and Downtown Portland, with additional locations imported by name from OpenStreetMap. Satellite and dark map views show how traffic responds to changes in demand and incidents. Fixed random seeds allow repeatable experiments and comparisons under the same starting conditions. Scenarios can be saved, and results exported as CSV.
Key Features
- •Live traffic simulation on real street networks, with map updates over WebSockets
- •Accidents, one-way or two-way road closures, and demand surges with adjustable severity and duration
- •20-minute congestion forecasts evaluated against simulation results, with MAE, RMSE, and a simple baseline forecast for comparison
- •Detection of unusual changes in delay, speed, and traffic volume
- •Traffic analyst that answers questions and explains bottlenecks using current simulation data
- •Scenario comparisons that use the same random seed and show changes for each road
- •Congestion heatmap, replay by minute, demand and playback controls, and keyboard shortcuts
Technical Highlights
- •Deterministic traffic engine with speed-density relationships, vehicle routing, and signal cycles at four-way intersections
- •FastAPI backend with PostgreSQL storage; the simulation advances once per second
- •Ridge regression using lagged traffic measurements for forecasts, and IsolationForest for anomaly detection
- •Place-name geocoding and road network imports from OpenStreetMap
- •Next.js frontend with MapLibre GL for maps, Recharts for data visualization, and Tailwind CSS
- •CSV exports of metric histories and baseline-to-scenario comparisons
Congestion Heatmap
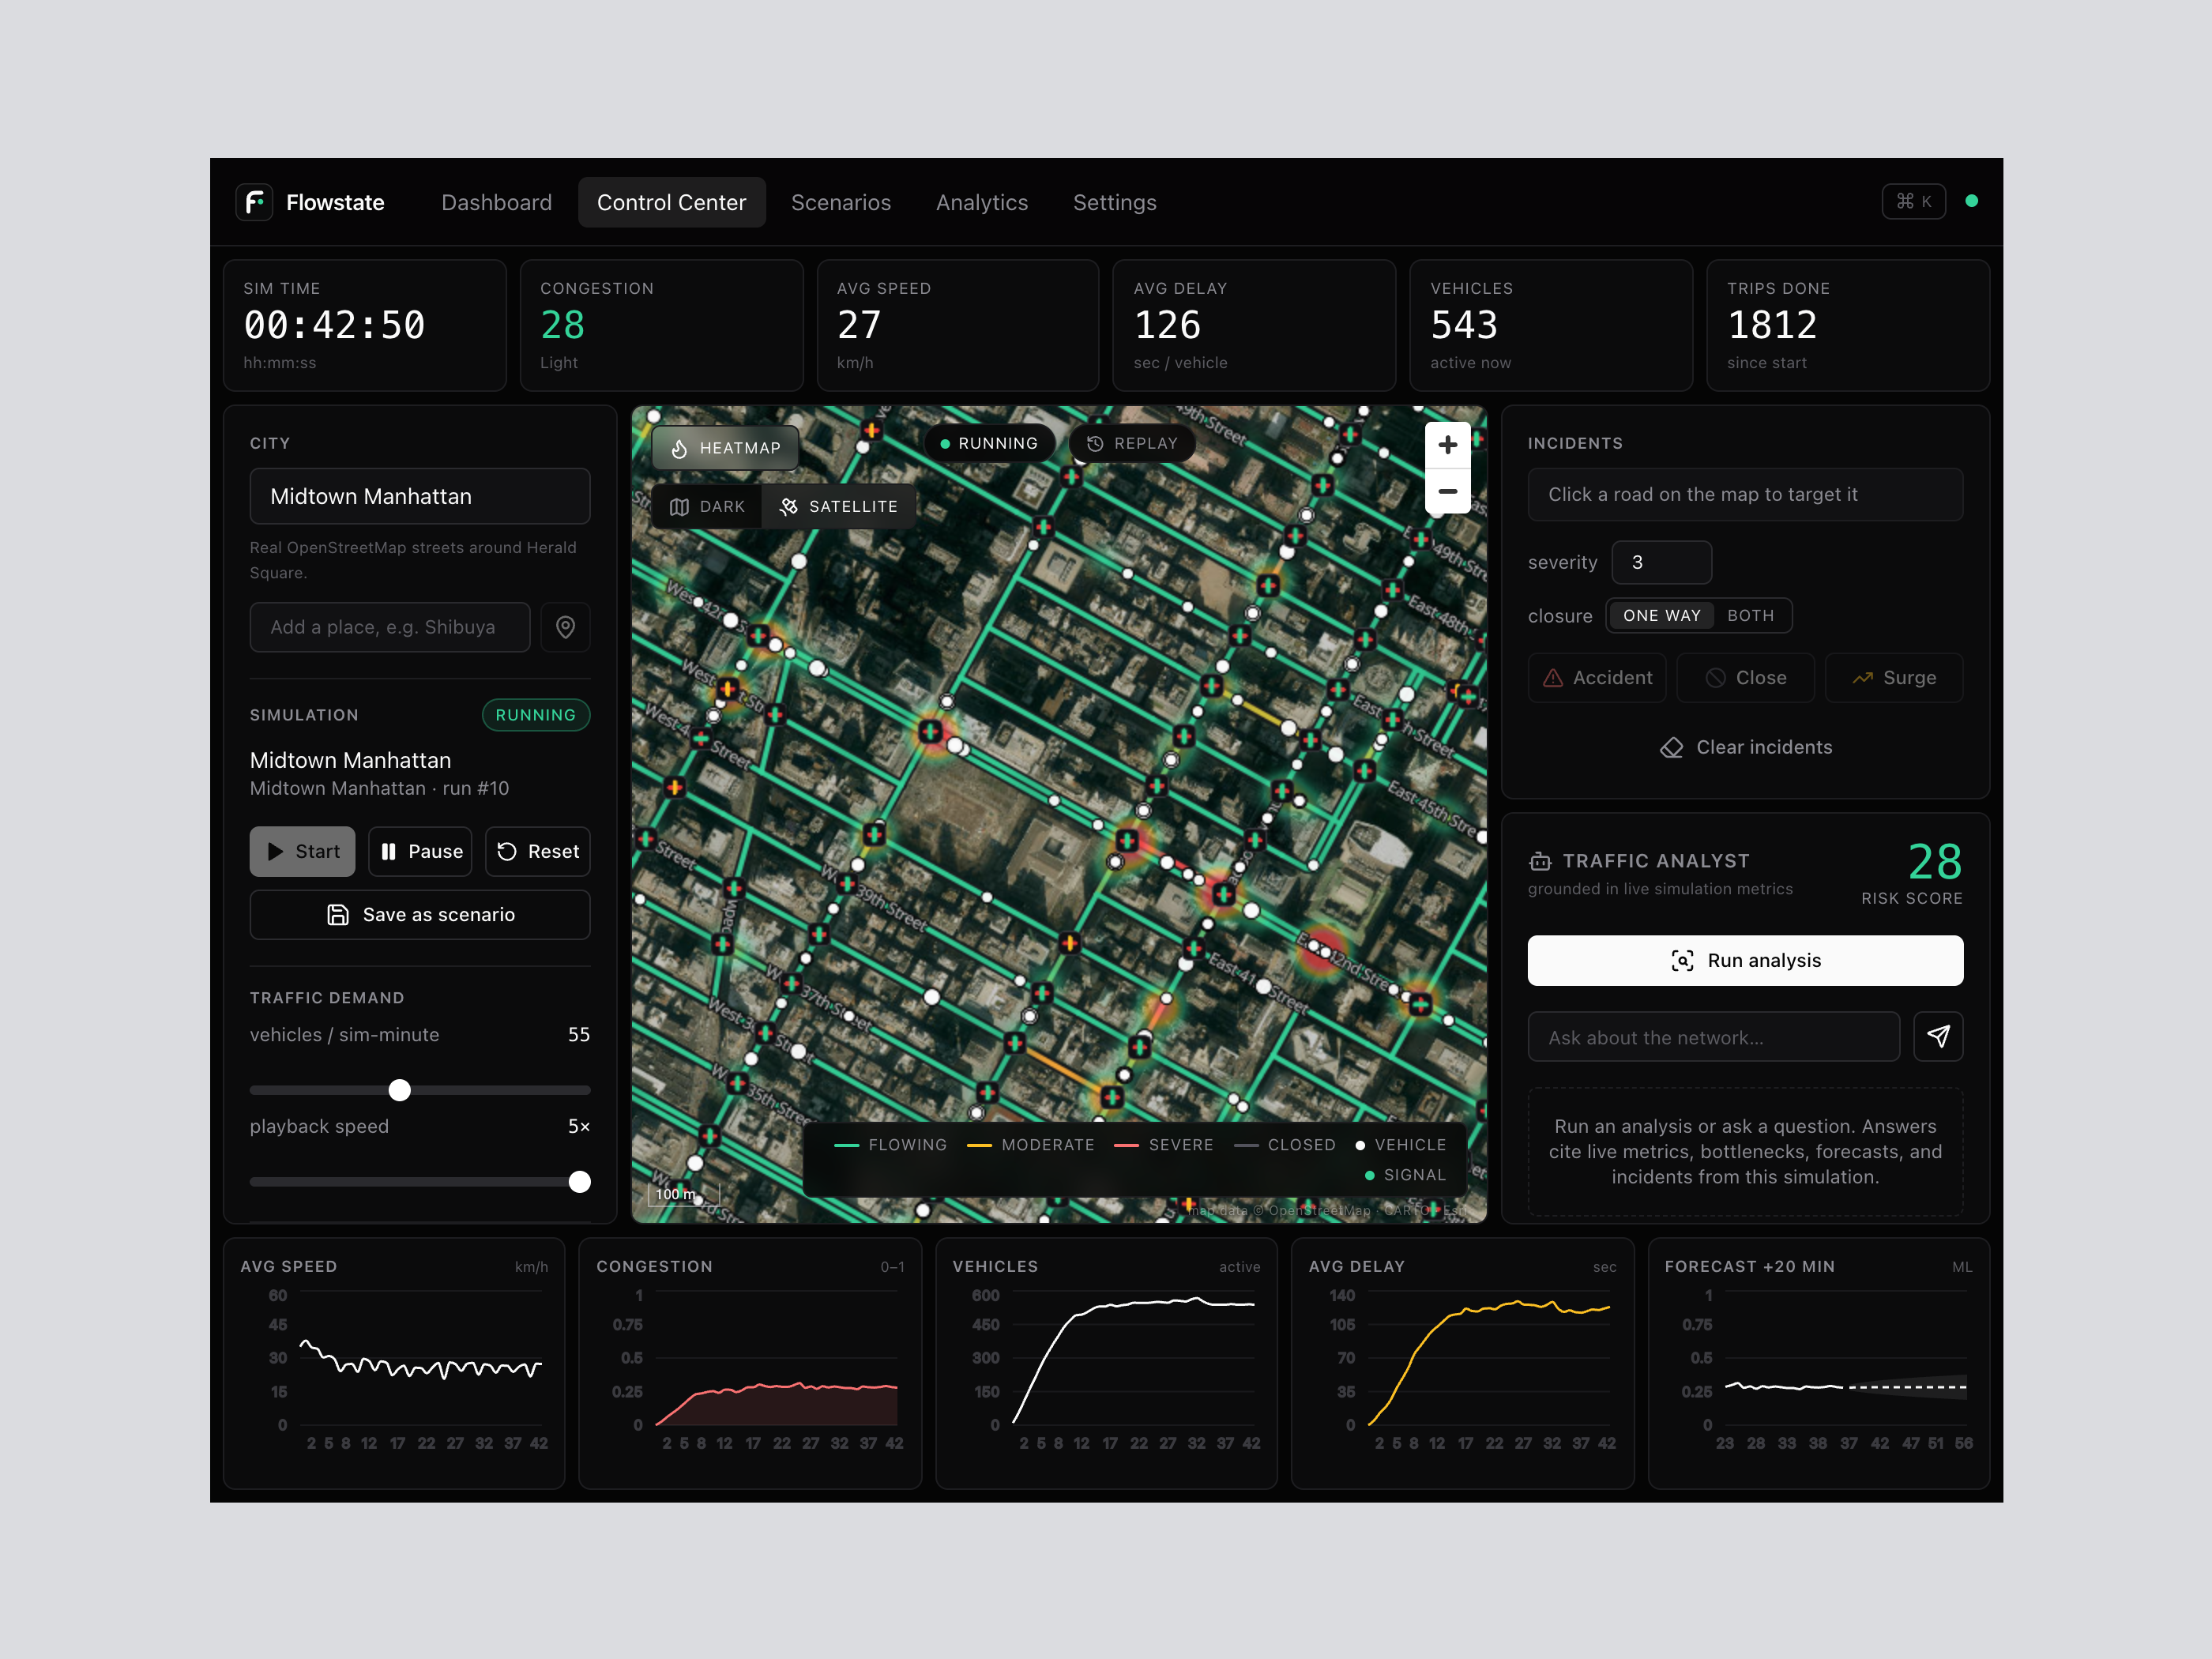
Congestion at intersections in the Midtown Manhattan simulation. The heatmap shows traffic conditions, with current metrics above the map and charts below.
Incidents and the Traffic Analyst
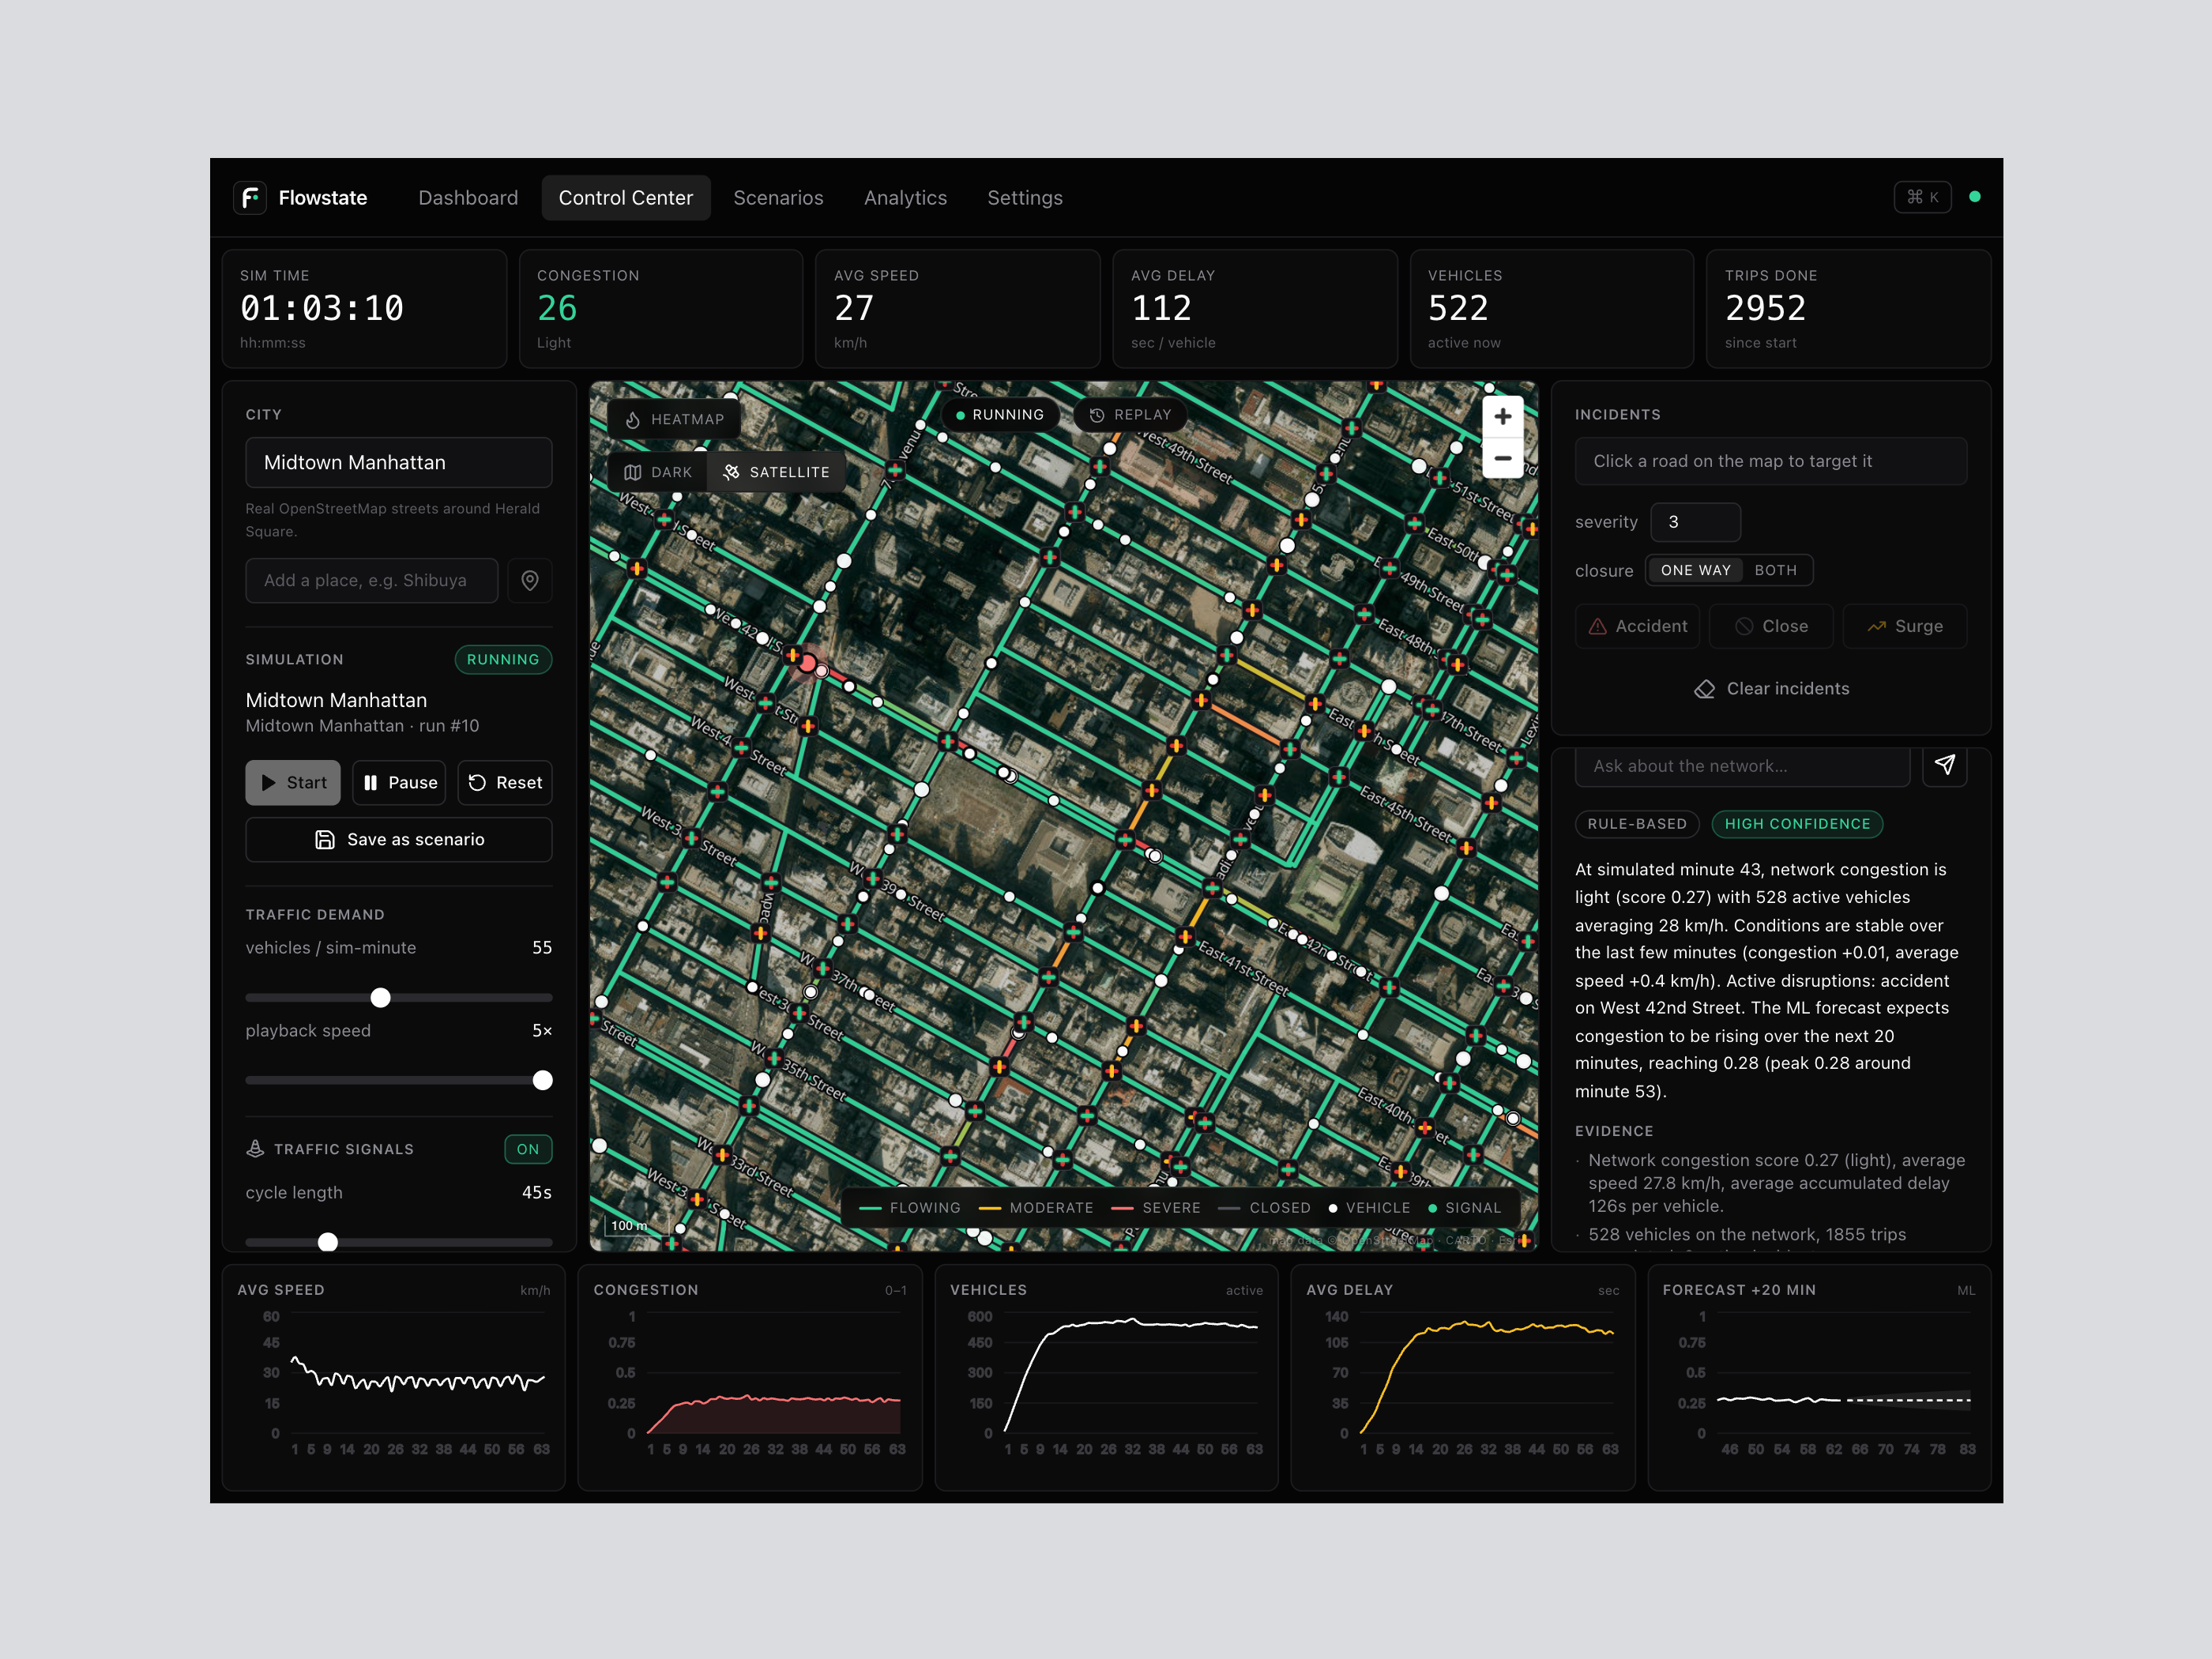
A simulated accident on West 42nd Street. The analyst uses current traffic data to describe the disruption and identify bottlenecks.
Analytics and Forecasting
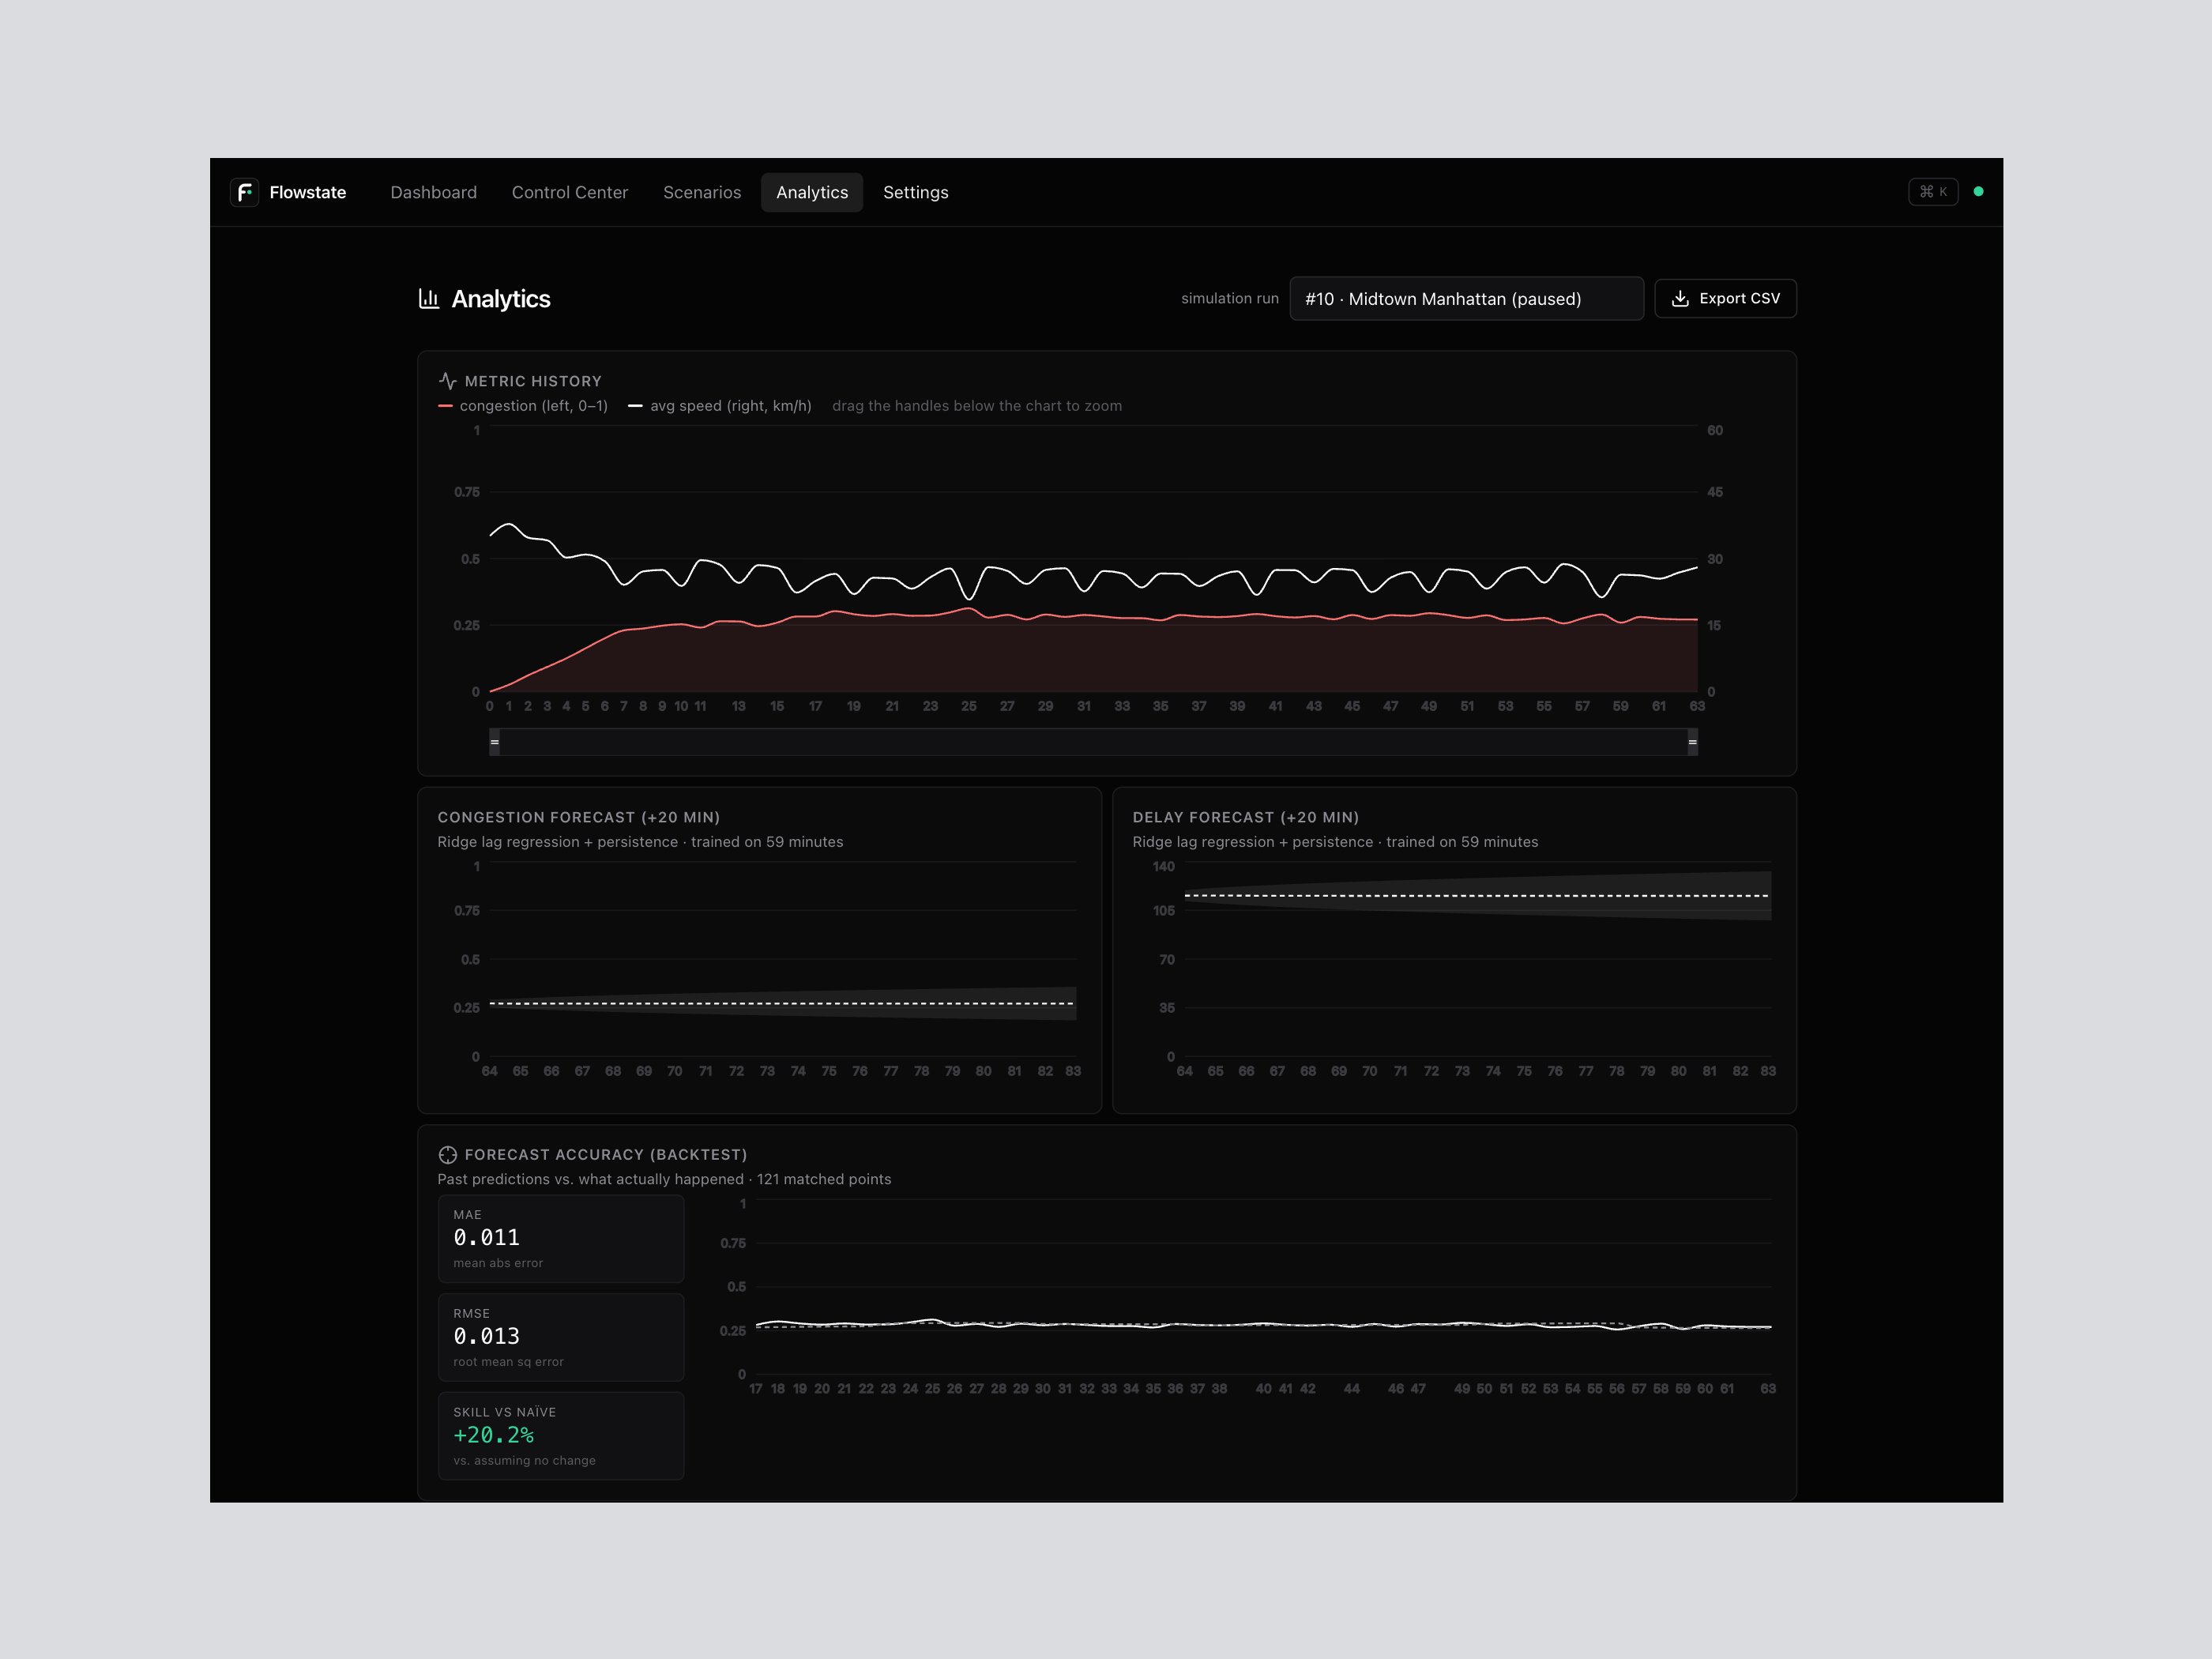
Traffic history alongside 20-minute congestion and delay forecasts. The backtest compares earlier predictions with simulation results to measure forecast accuracy.
Scenario Lab
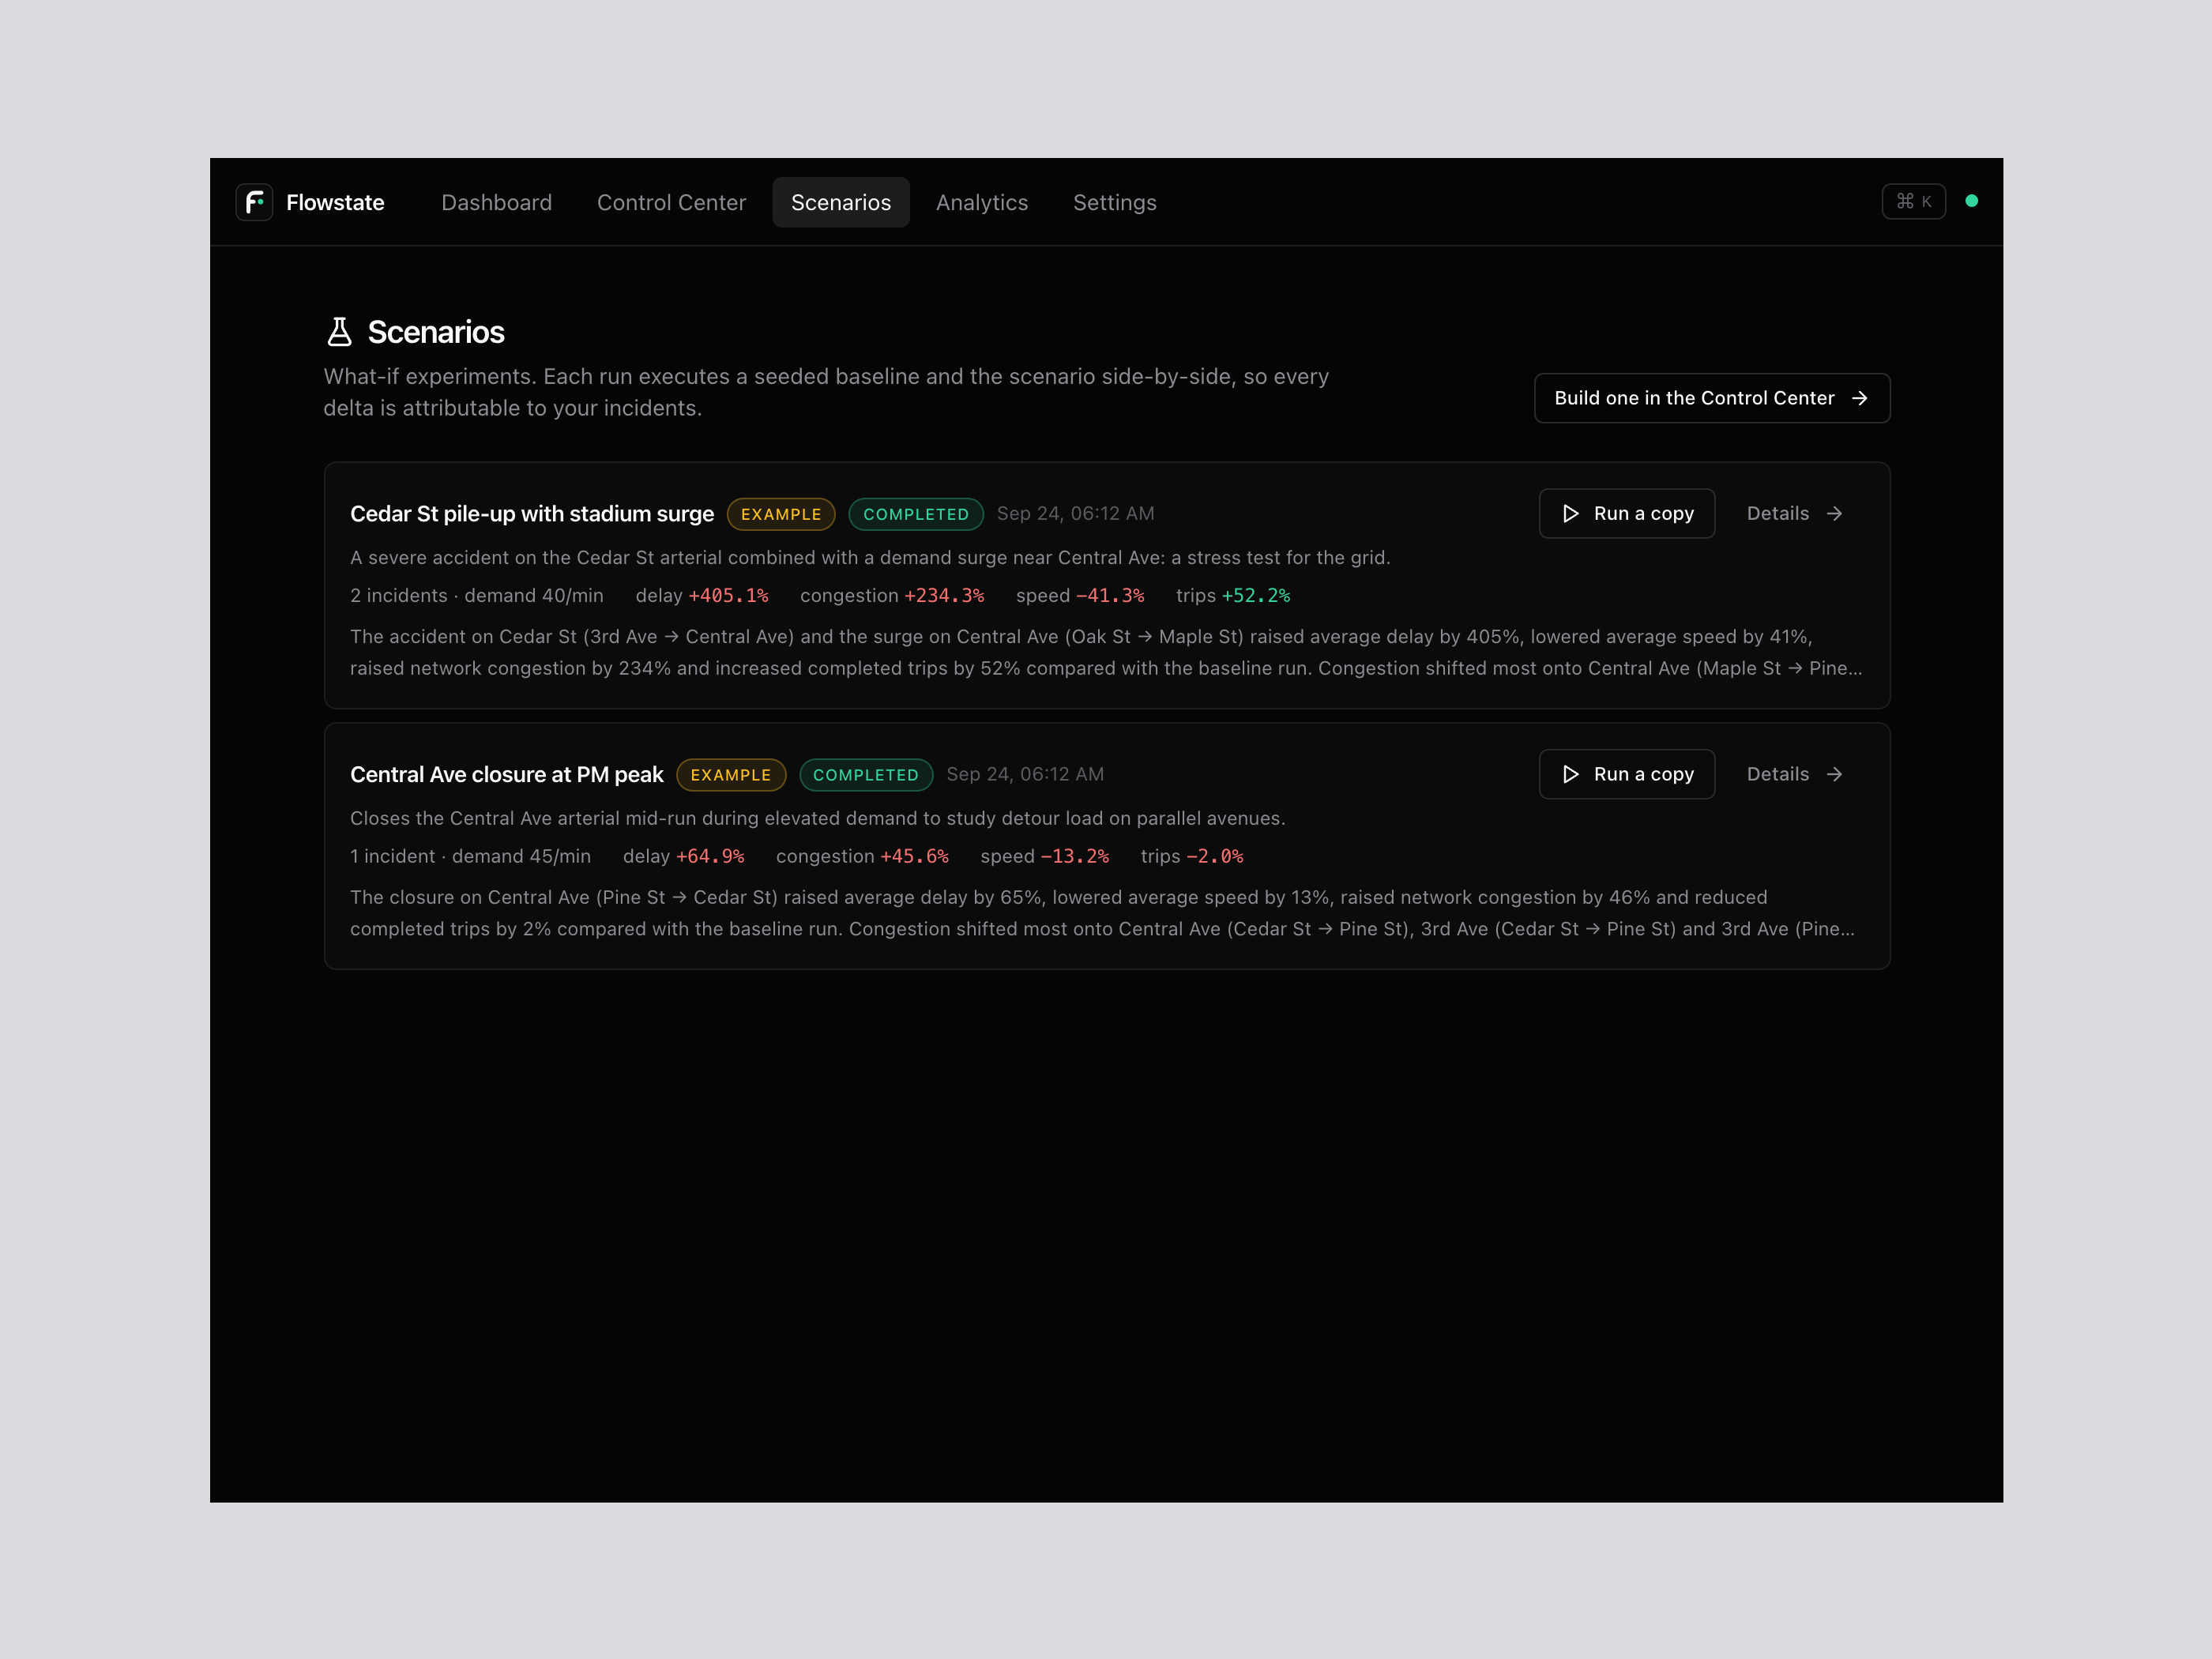
Saved traffic experiments. Each scenario runs alongside a baseline with the same random seed to compare delay, congestion, speed, and completed trips under matching conditions.
Baseline vs Scenario
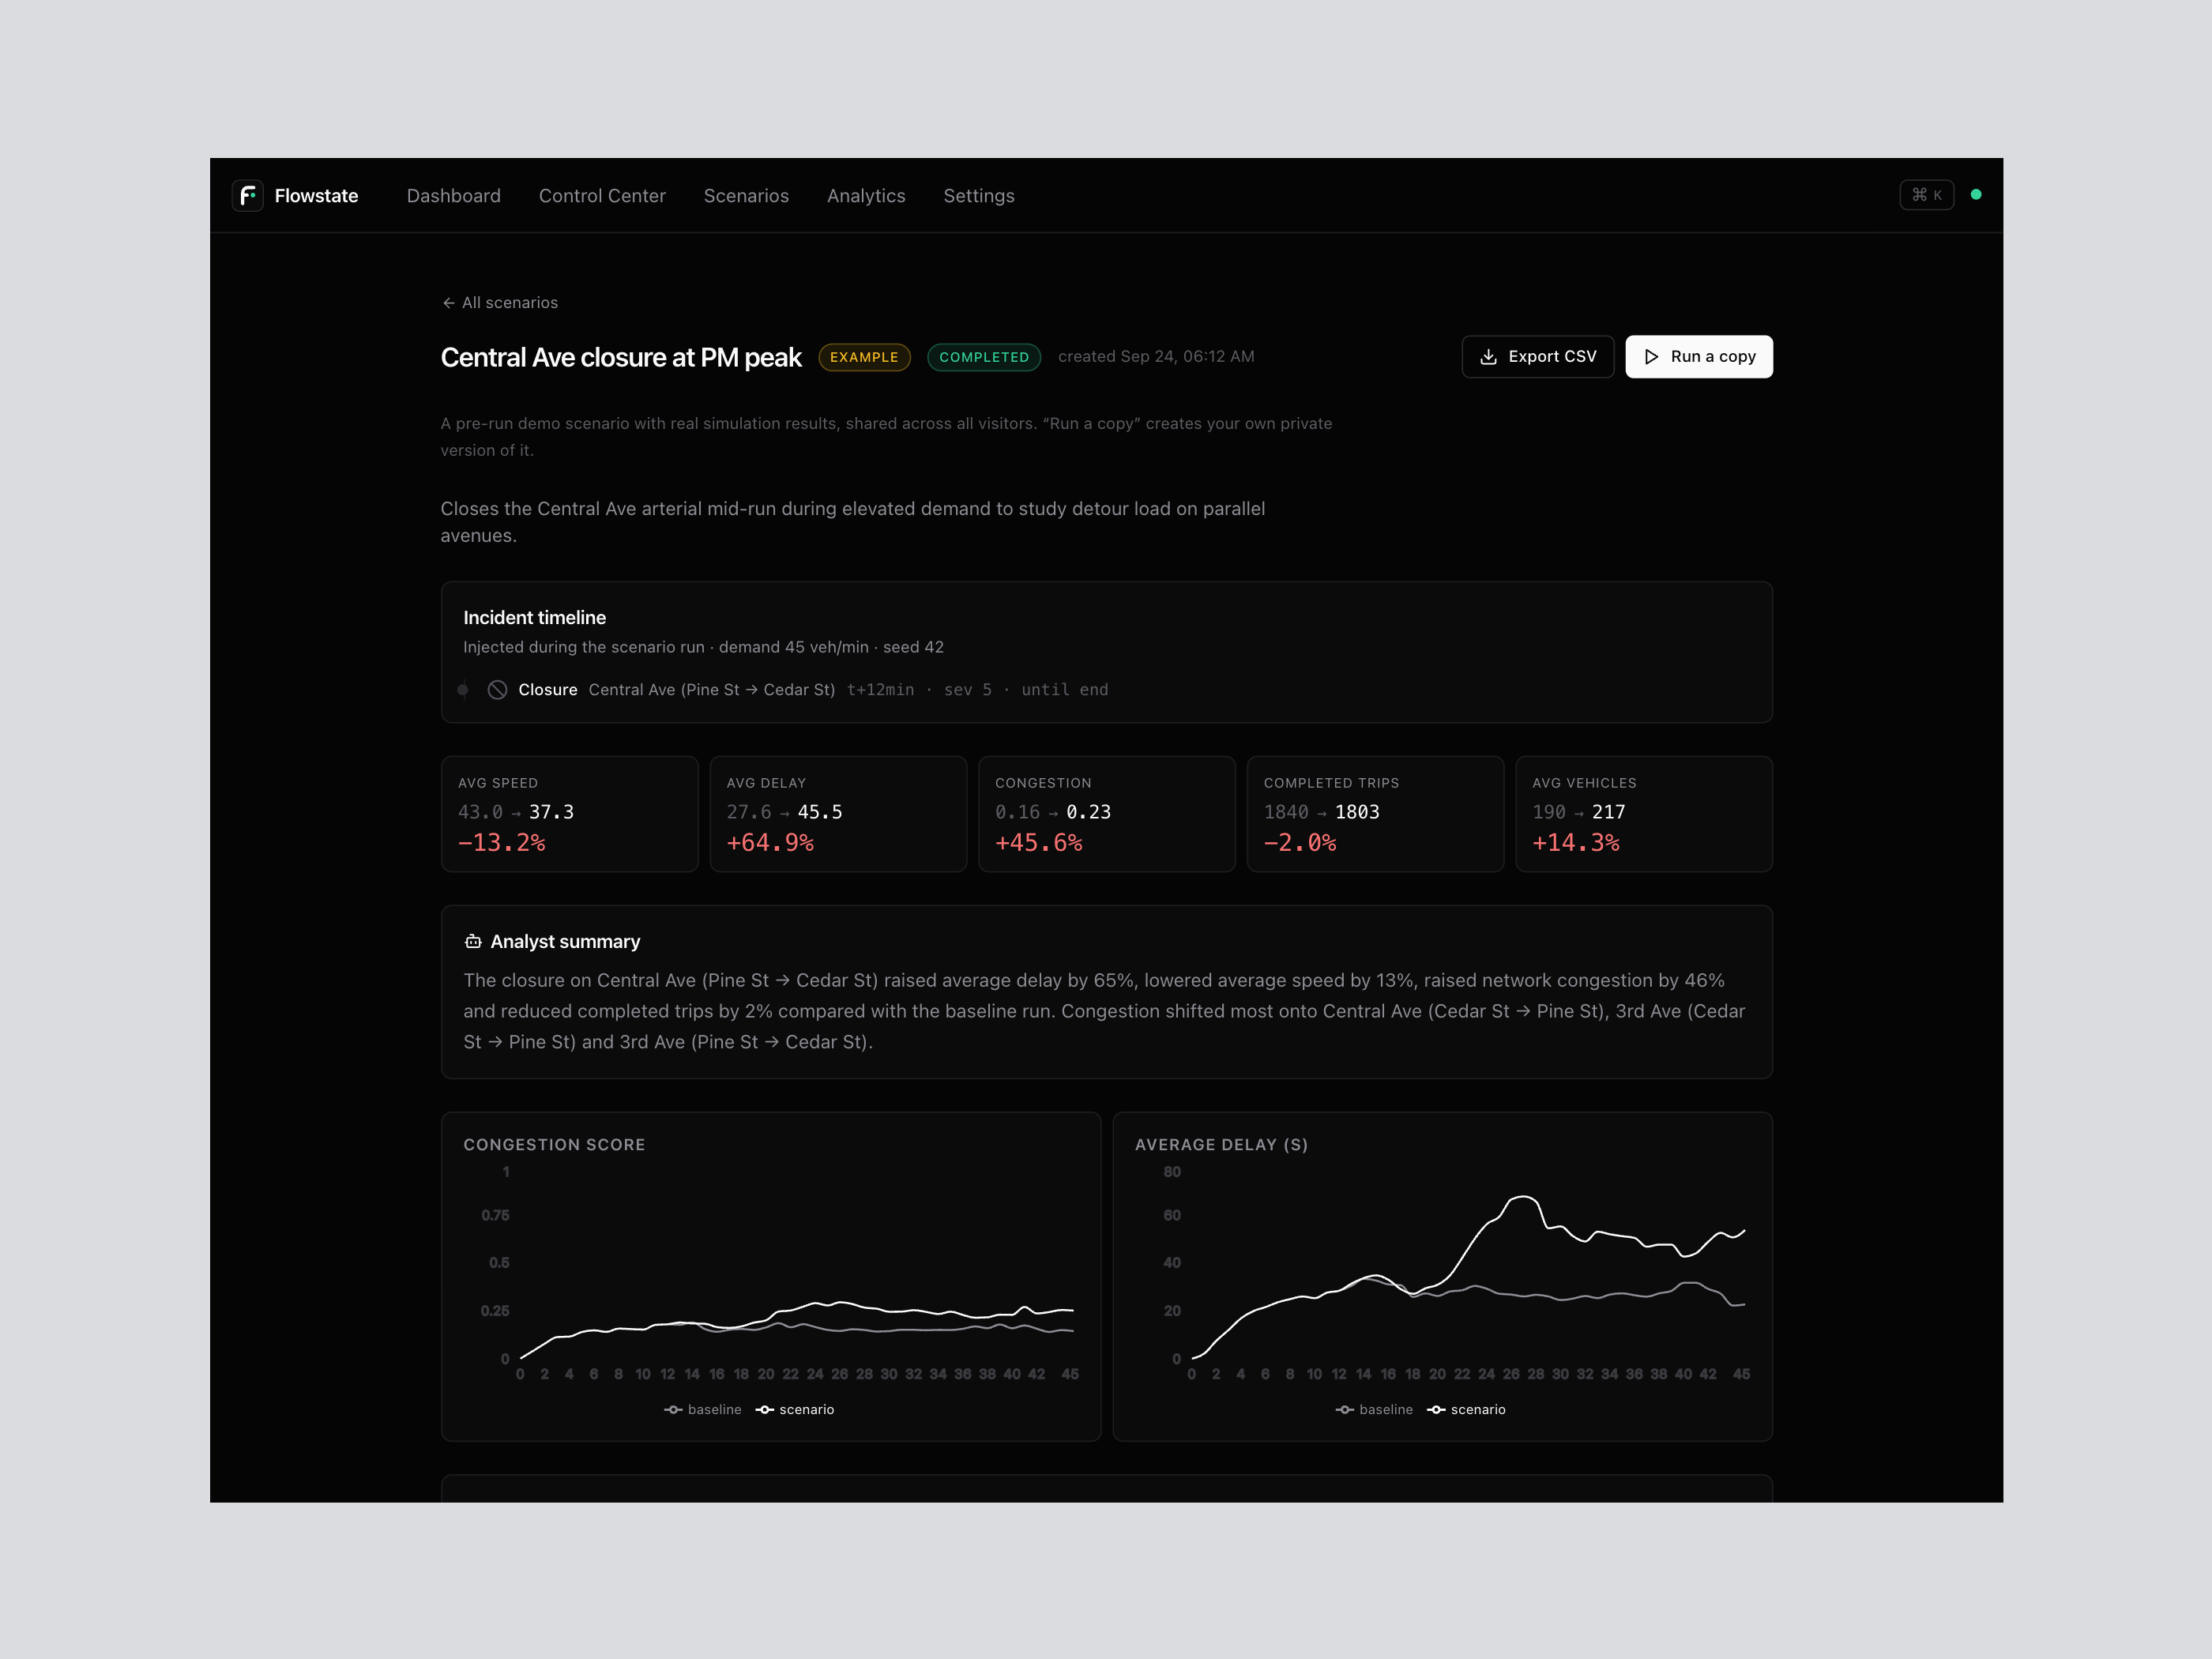
A completed road-closure scenario, with the incident timeline, changes from the baseline, and the analyst's summary. The charts compare congestion and delay across both runs.
Dashboard
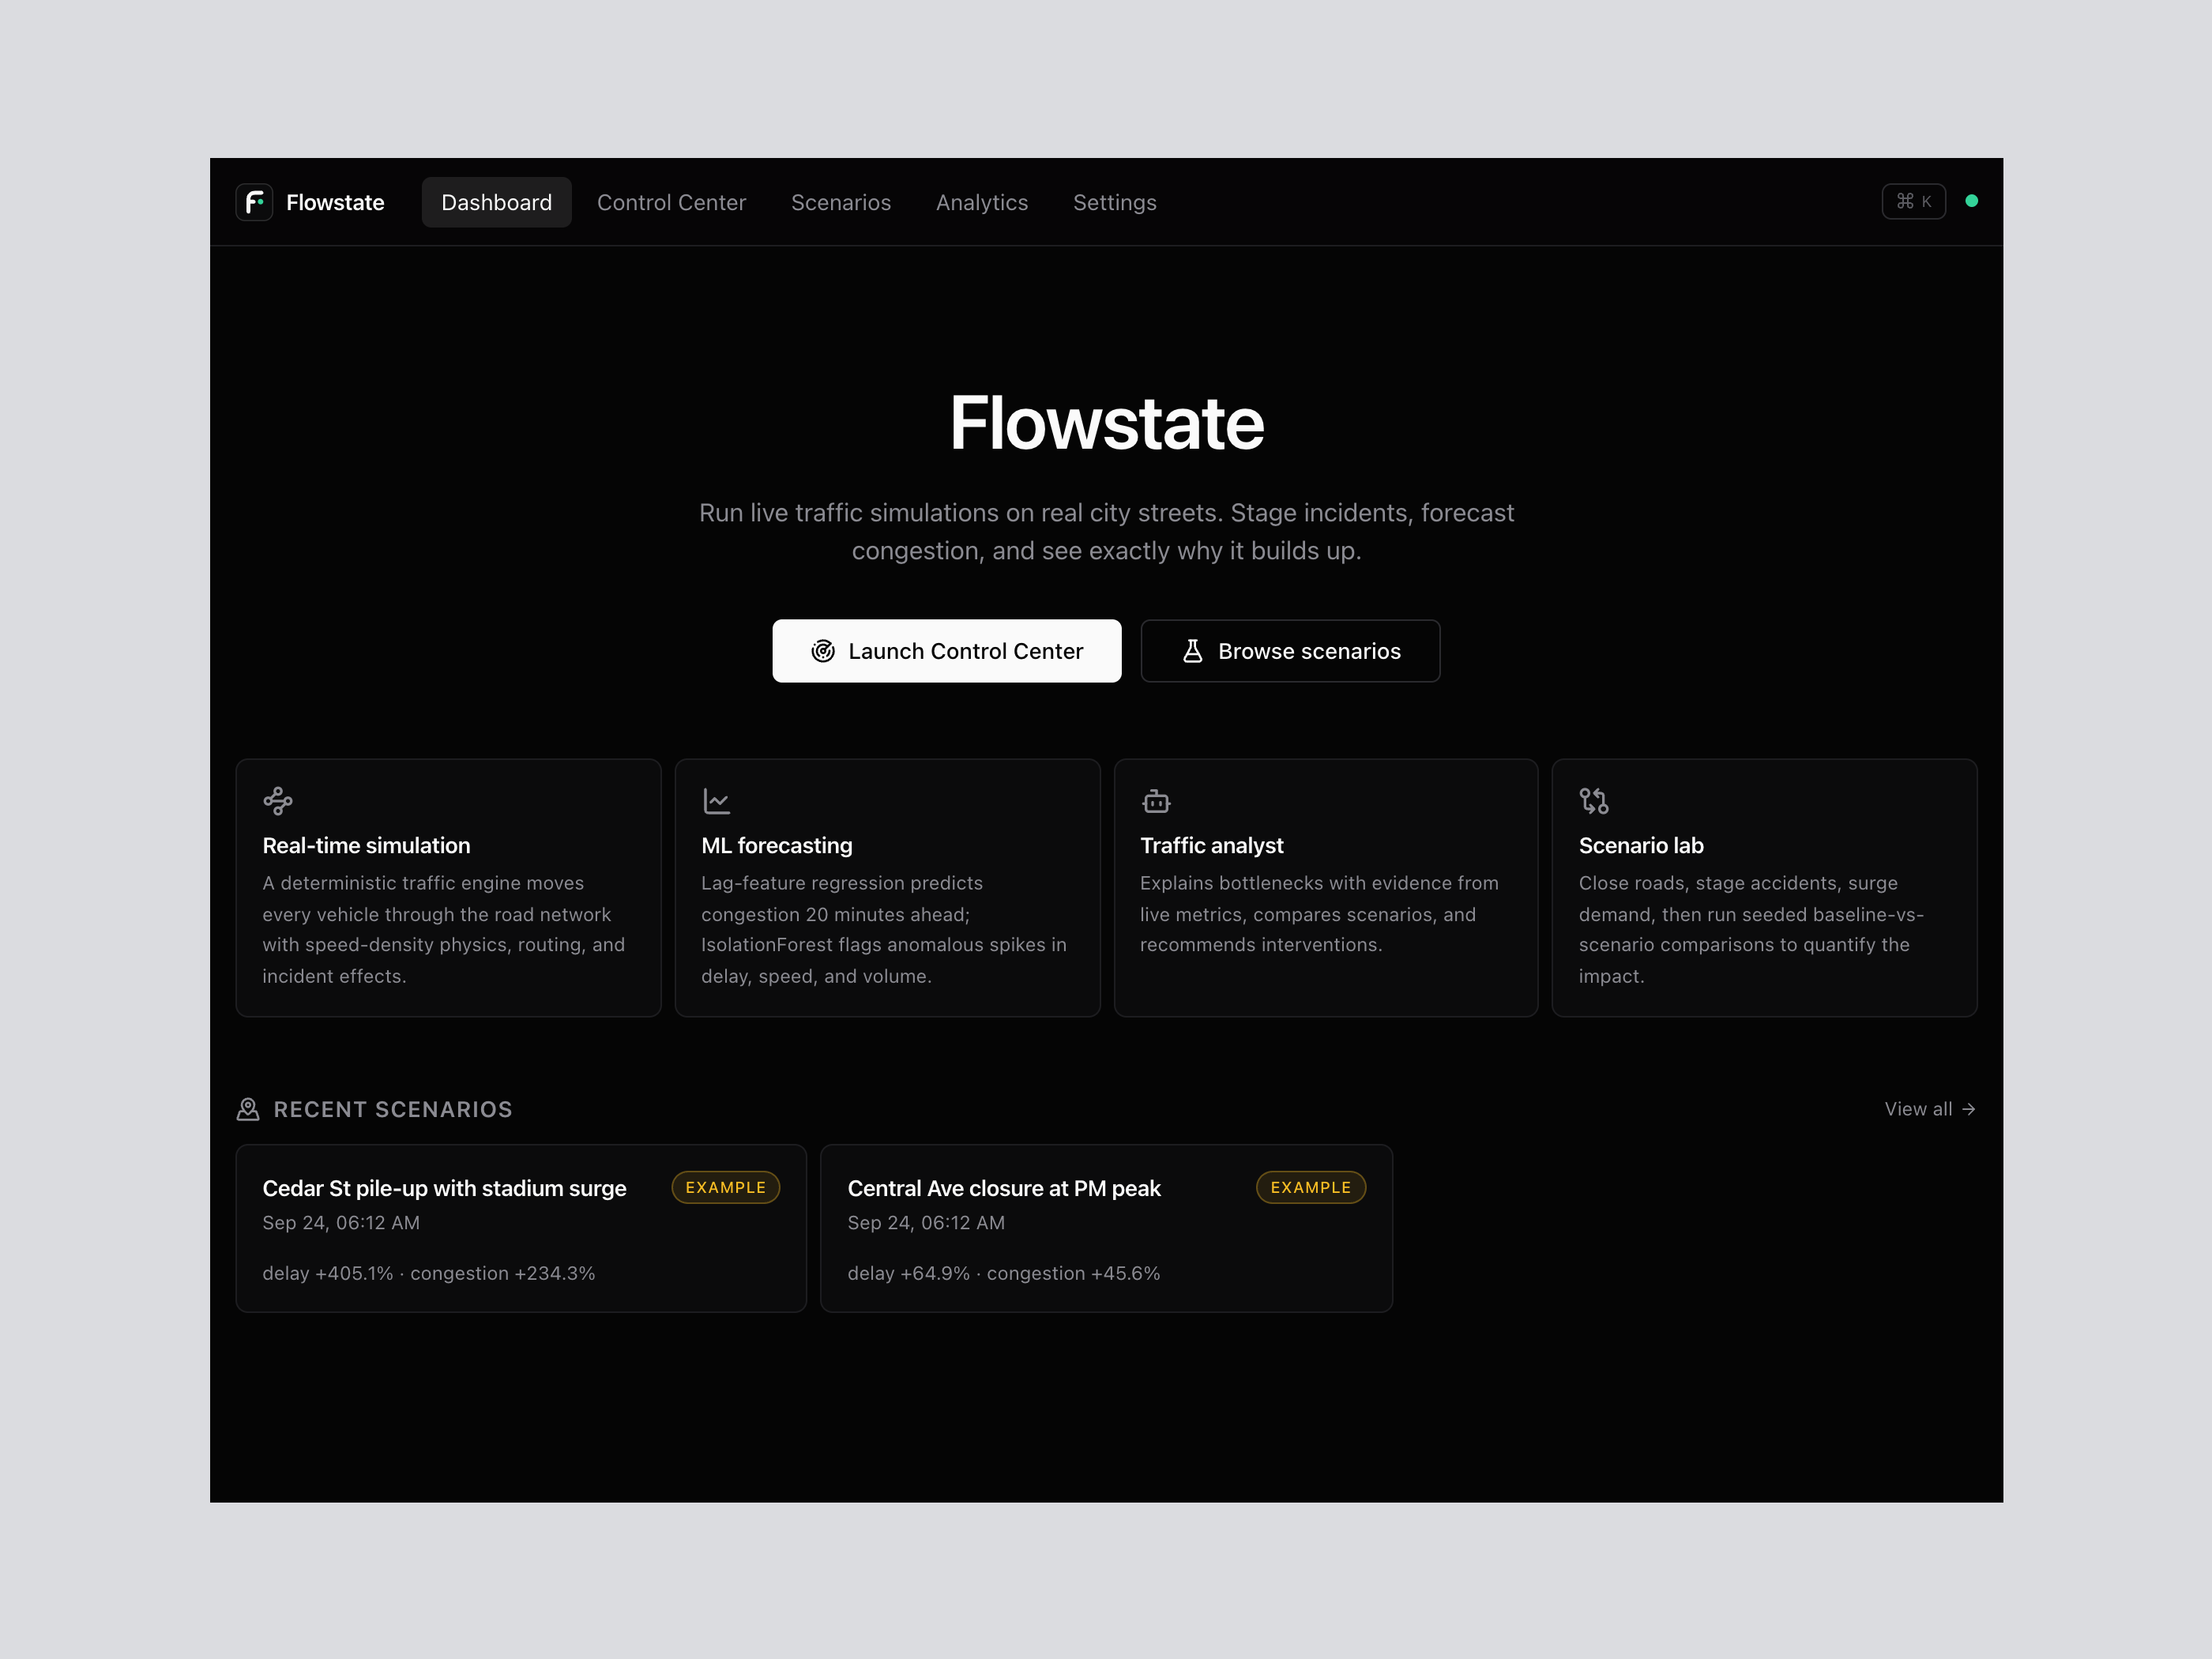
The main dashboard provides access to the Control Center and saved scenarios, with an overview of the simulation, forecasting, traffic analysis, and scenario tools.
Next Project